Global gene
expression profiles in H. sapiens and differentiation
http://apollo11.isto.unibo.it/
1. Microarray
Expression
Profiling (credentials @unibo.it are
required)
Array Printer - MicroGrid II - Array Reader - GenePix 4000 (Axon)
Hybridized
slide - Expression
profiles
NCBI Gene Expression
Omnibus (GEO)
NCBI Gene
OMIM
2. Whole Human
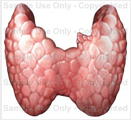
Thyroid Transcriptome Map

Human
Thyroid Transcriptome Map
Building
the reference gene expression profile of human thyroid
Non-thyroidal
tissues used for the differential gene expression study
Study of the differential
gene expression of 26,750 loci (thyroid vs. non-thyroidal
tissues = A vs. B).
For example, an A/B ratio of 10 indicates that the gene
RNA is 10 times more abundant in the thyroid compared to
non-thyroidal tissues.
Fo example, an A/B ratio of 0.1 indicates
that the gene RNA is 10 times more abundant in the
non-thyroidal tissues compared to thyroid.
Loci whose symbol begins with FLJ, Hs., LOC
are uncharacterized and could be genes to be discovered.
Search in NCBI Gene
the "Gene name" (gene symbol) of genes highly
overexpressed in the thyroid compared to non-thyroidal
tissues.
2.1 Are
the functions of these genes consistent with the known biology
of the thyroid (structure and function)?
2.2 Searching
these gene symbols in OMIM, can
phenotypes associated with mutations of these genes be found?
